Cartographia
Welcome to Cartographia
With the Cartographia application you can quickly and easily make interactive maps of your spatial data. All you will need are a spreadsheet with place names, location data (longitude and latitude), and characteristics of the place.
Once you make a map on Cartoviz you can download it and share it. You won’t need our server: your map will be a fully self-contained webpage. Double-click on the downloaded file and it will open in your preferred browser (e.g. Firefox, Chrome, Safari, Edge
In Cartoviz, you specify your map design along with your data instead of clicking and drawing, as with a Graphical User Interface (GUI). Avoiding a GUI has many advantages. You data and design are in the same place, so it's easy to reproduce your map later without redoing dozens of mouse-clicks. It's also easy to make many similar maps, one for each county or village, for example.
Getting started
Our non-GUI interface is different but simple. Below are some example maps. Find one that matches your needs and click through for instructions.
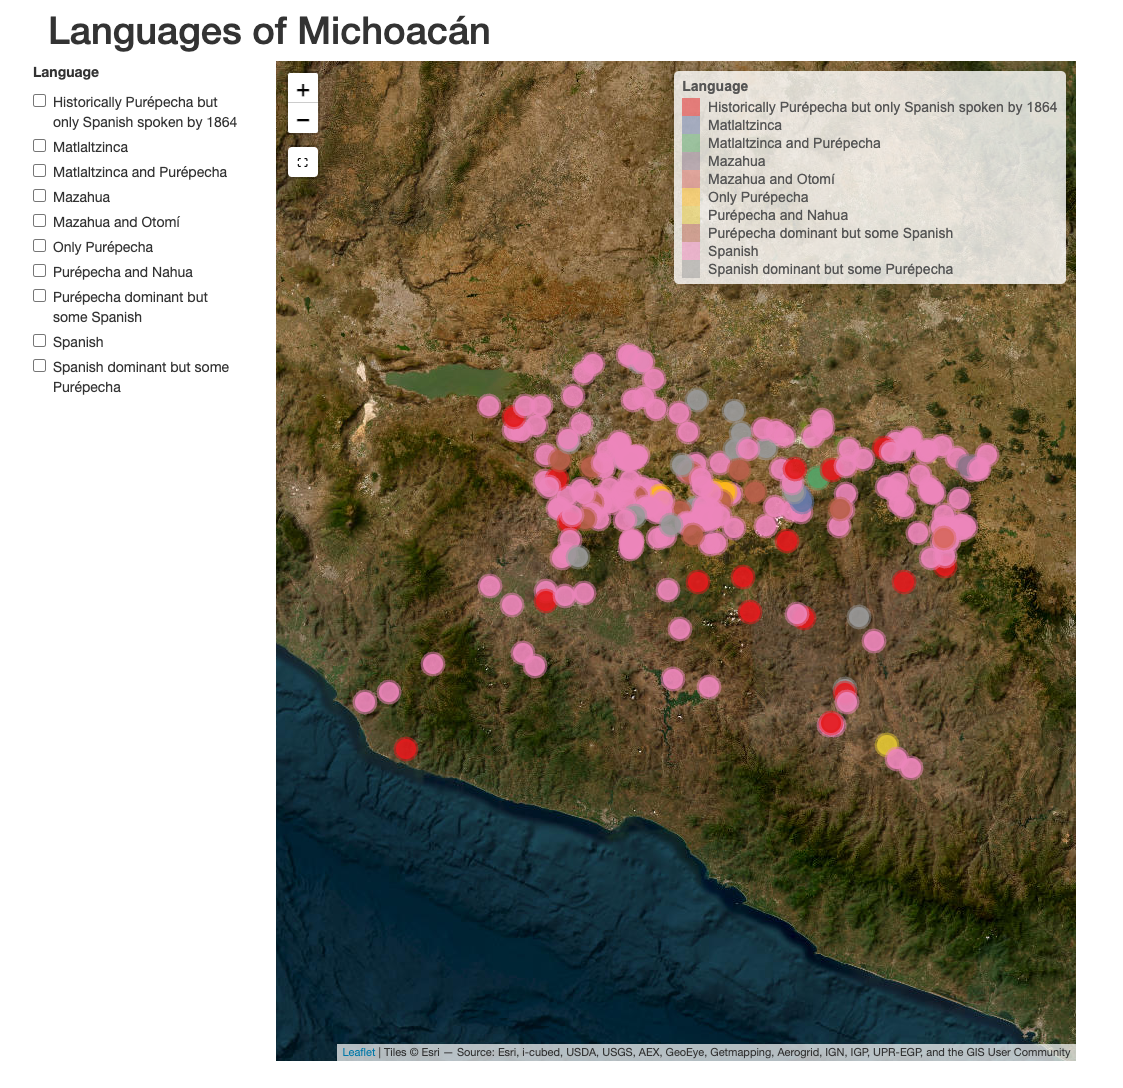
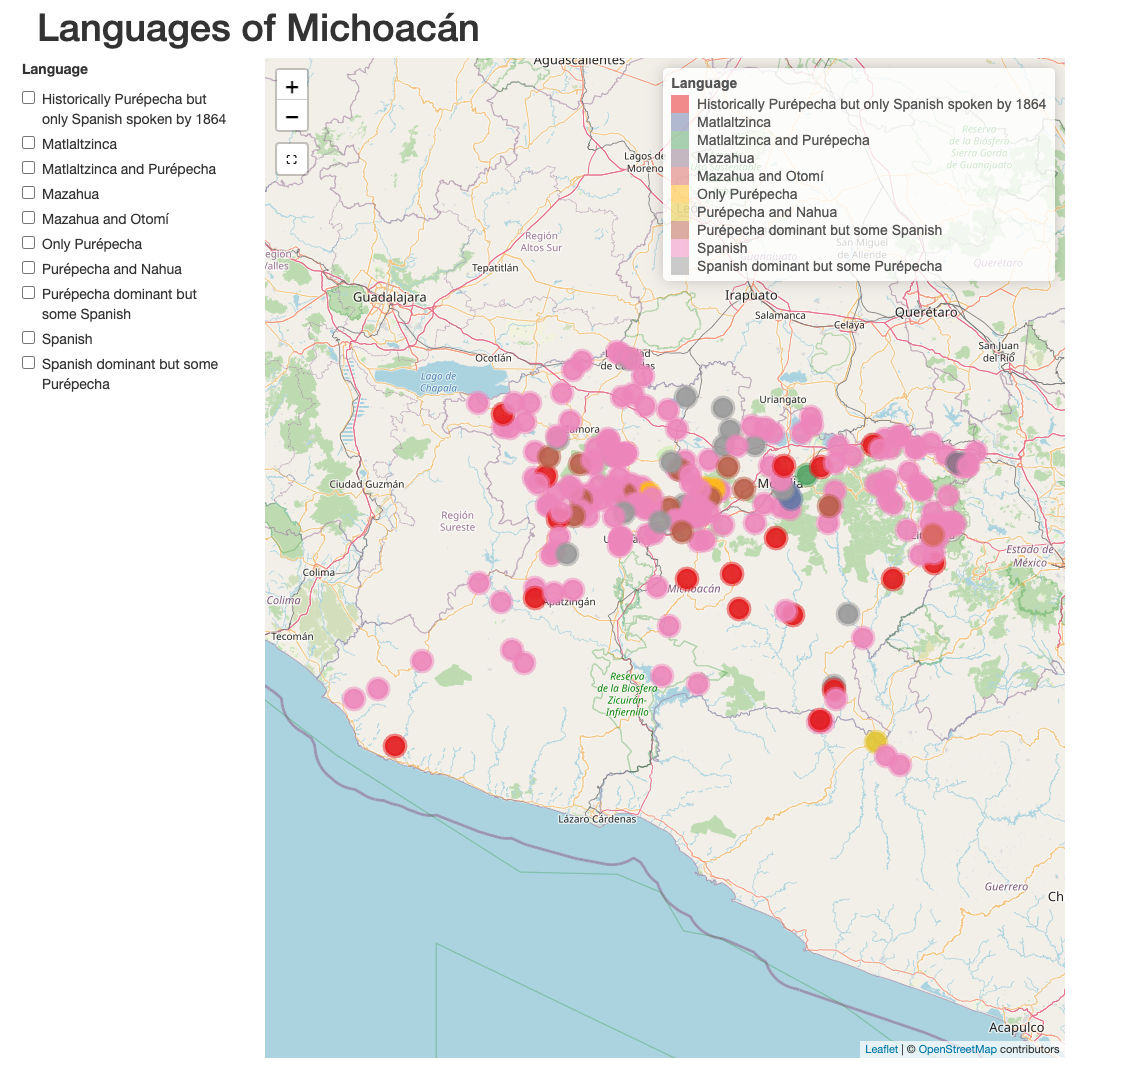
Basic map:
Users can select categories with a checkbox and can see additional data in mouseover and pop-ups
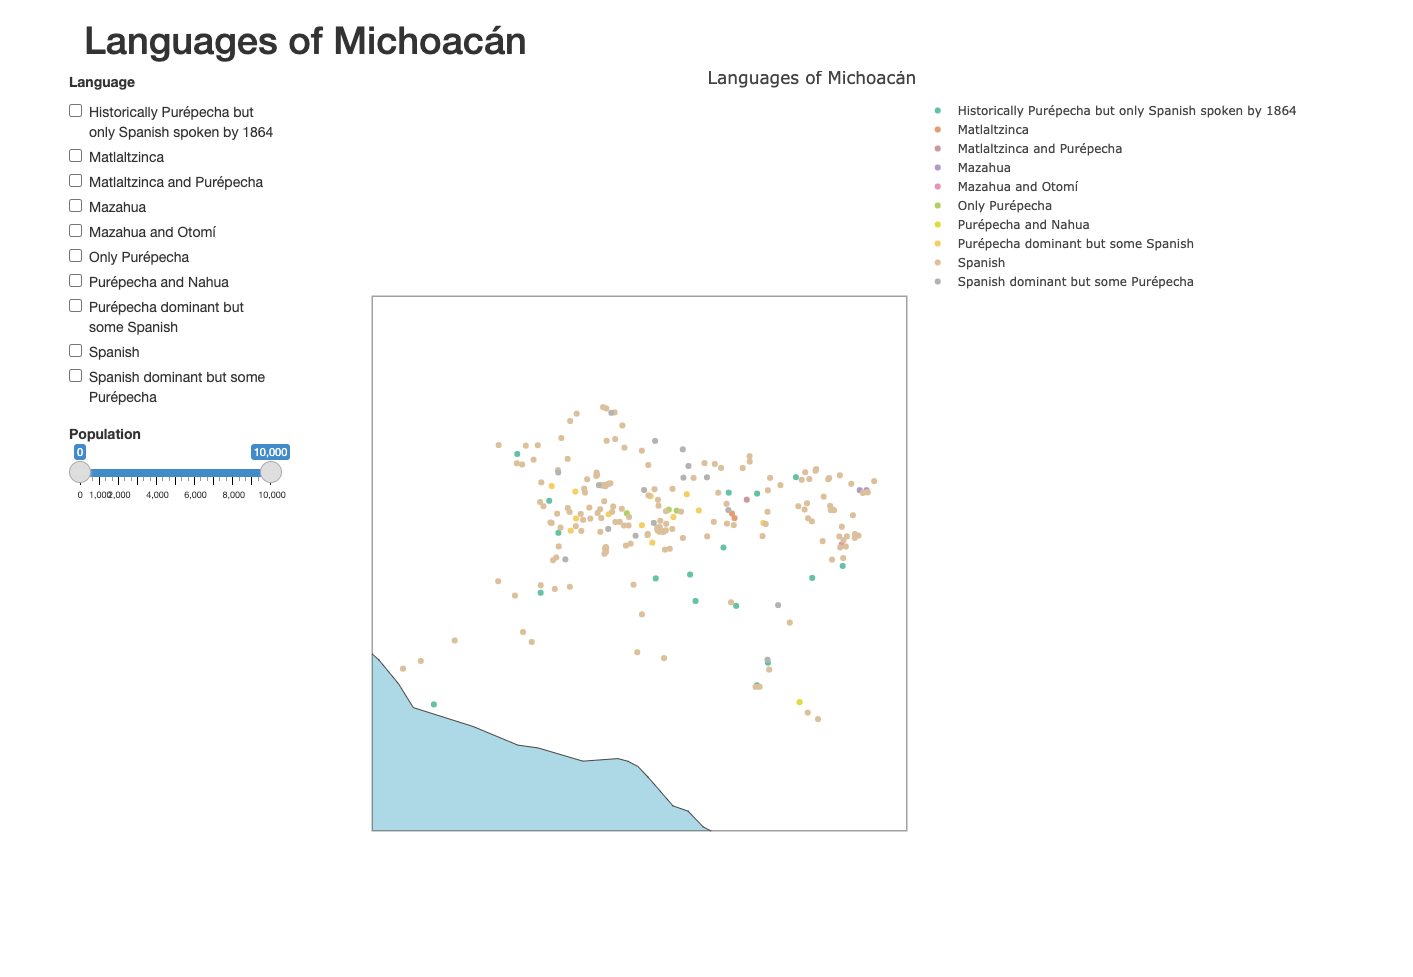
Example data: Languages of Michoacán
| Outline map | Terrain map | Modern street map |
|---|---|---|
|
|
|
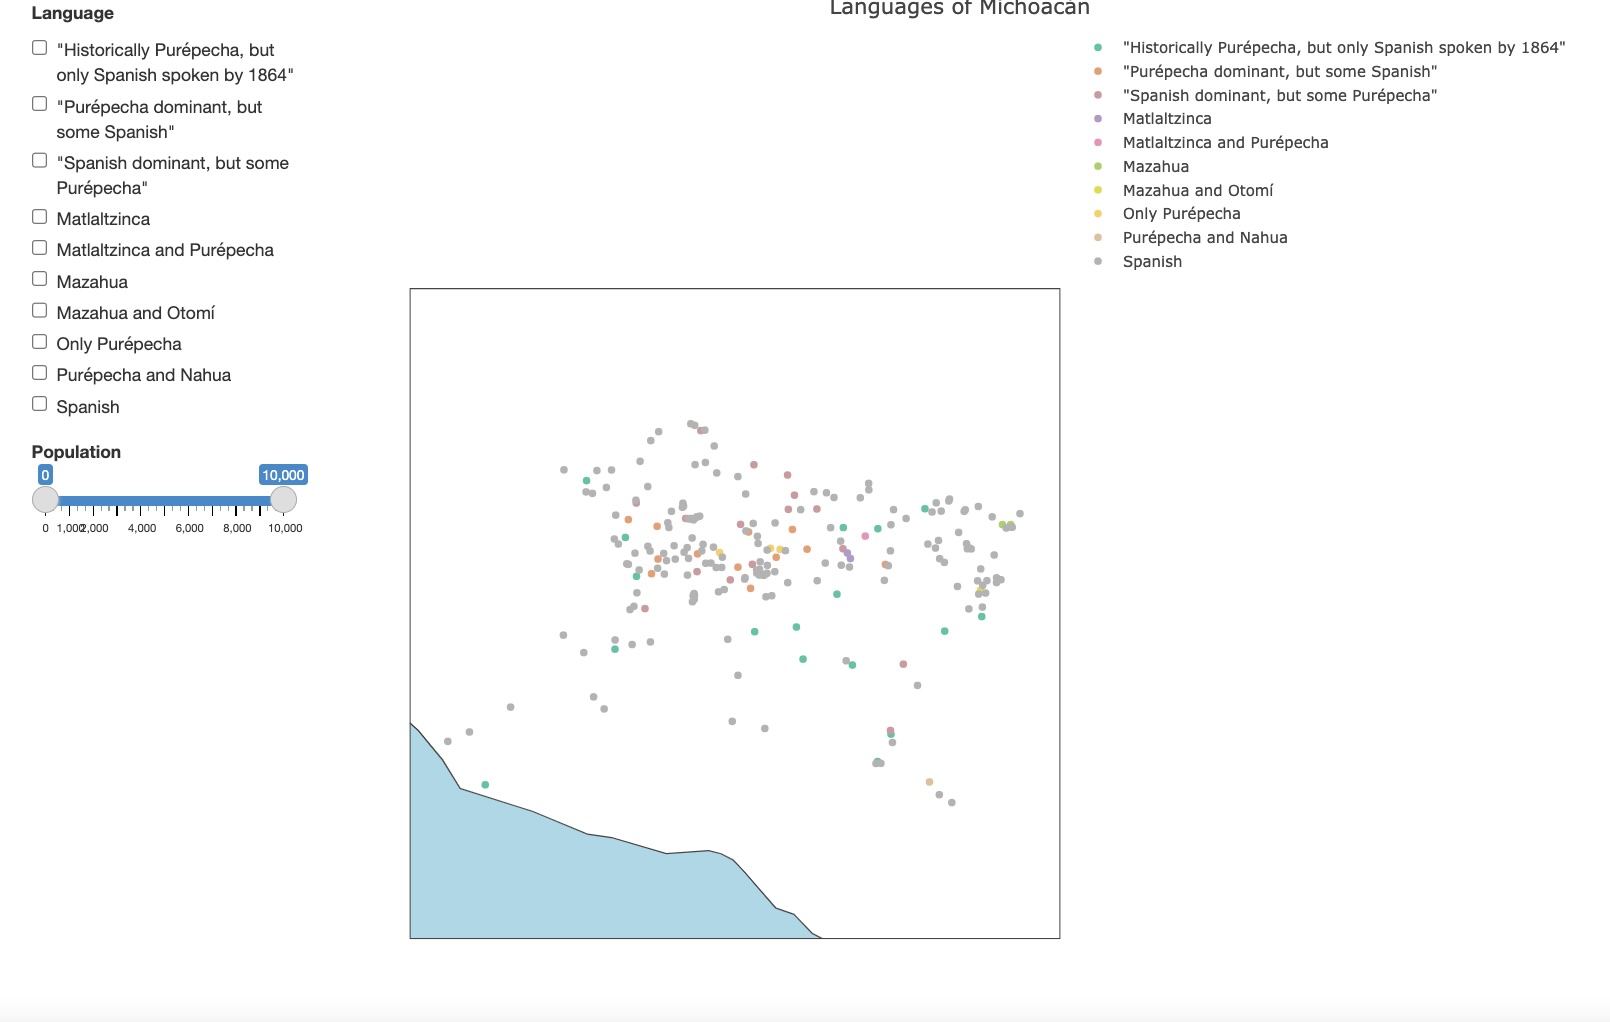
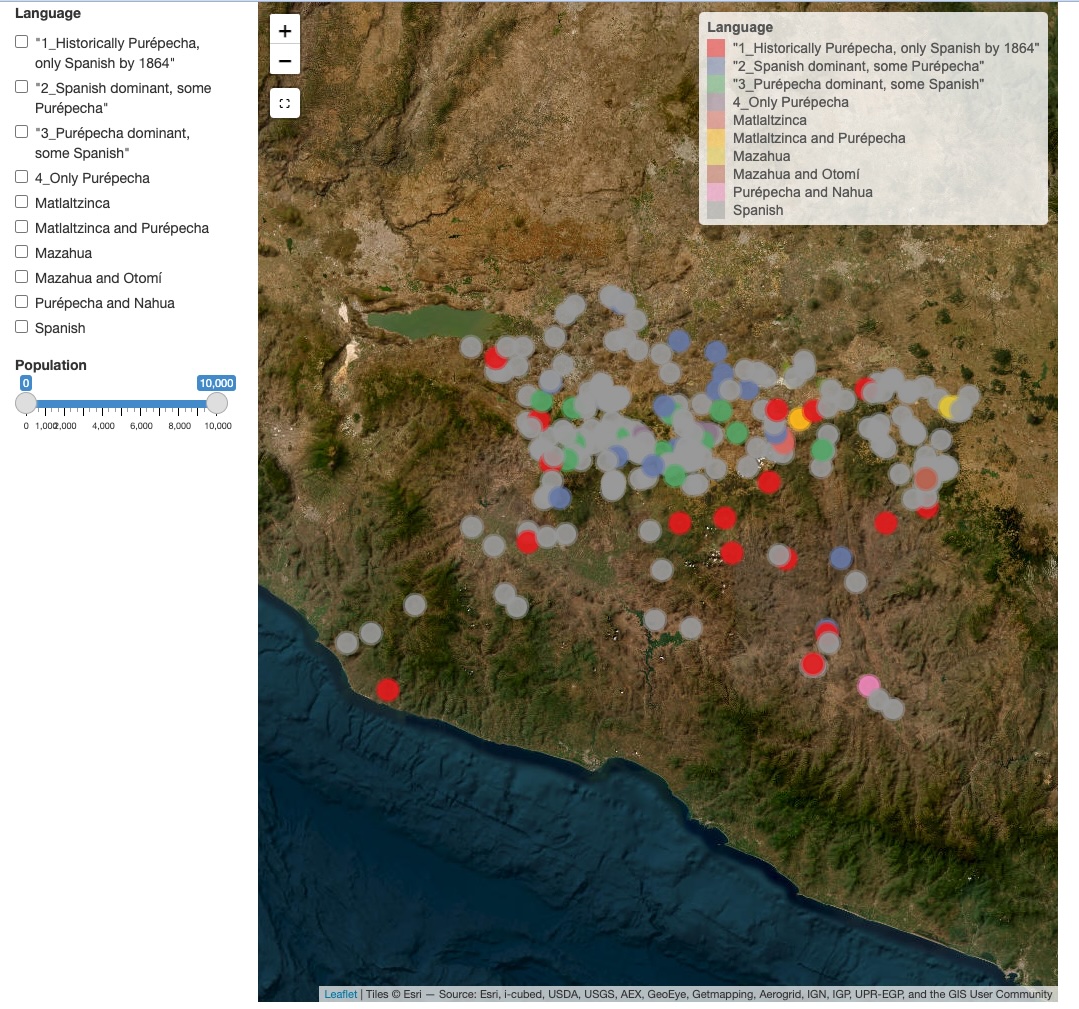
Options: Add numeric selector to basic map
In addition to category, users can select by a numeric value
Data: Languages of Michoacán
| Outline map | Terrain map |
|---|---|
|
|
Options: Choose a map projection
For global or multinational data, you may want to choose a specific map projection. Cartographia defaults to a globe, but also supports a range of world map styles.
Data: Nuclear Power Plants
|
Outline globe with
two sliders and one checkbox |
Outline map (Mollweide projection) with
two sliders and one checkbox |
|---|---|
|
|
|